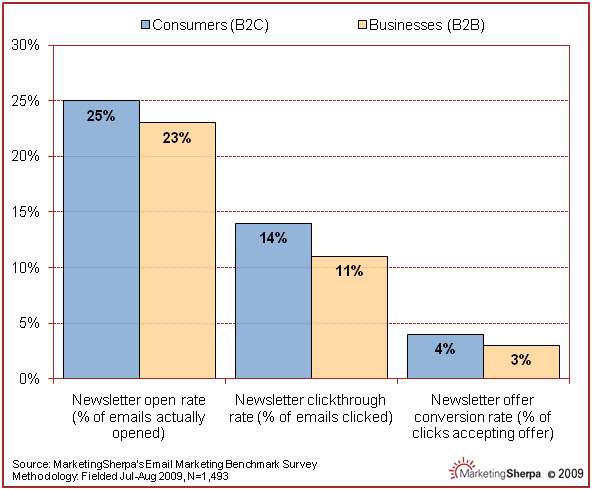
A recent Marketing Sherpa article about average open rates published this interesting chart.
The research was compiled based on data from nearly 1,500 marketers. The chart compares the performance of B2B email newsletters to the performance of B2C e-newsletters in open rate, clickthrough rate and conversion rate.
The open rate is usually defined as the ratio between the number of registered opens to the number of emails sent. Some email service providers, as well as some marketers, take it to the next step and count only the number of emails delivered in the ratio. (See this post on email bounce rates)
The clickthrough rate (or CTR) is usually defined as the ratio between the number of clicks to the number of emails opened. For example, if an email was opened by 100 subscribers to an ezine, and 30 of those subscribers clicked on a link, then the CTR would be 30%.
The conversion rate is usually defined as the ratio between the number of conversions to the number of clicks. A conversion can be anything, such as a sale, request for more information, additional subscription, or anything that you may ask your subscribers to do. For example, if, of those 30 subscribers that clicked on a link, 3 purchased something, then the conversion rate would be 10%. (Some marketers would say it’s 3%)
Clickthrough and conversion rates are important indicators of email newsletter performance. As newsletter publishers we should track these statistics, making sure we always apply the same metrics.
The research shows that B2C newsletters perform slightly better than B2B. How do your own results compare to these averages? Please comment and share your insights.


So many factors that can influence results including who is your audience – did they opt in to receive the newsletter, does the sender have a relationship with the recipients, headline effectiveness, quality of content, day it’s sent, time it’s sent and more.
The key is to measure, adjust and improve.
On one project we have a decent open rate, 25-30%, but a pretty low click-thru of 5-8%. This enewsletter teaser does not contain offers. Users click to read the continuation of stories. What makes this even more puzzling is that each vistor, on average, opens the enewsletter teaser email 2x. Why would they open multiple times (top opens are at 15-25x), but not click? Any tips would be most appreciated.
Hi Bill,
A good open rate indicates you have an interested audience, however, your content doesn’t seem to provide the stuff they are expecting (low clicks).
Actually, your click rate is probably average.
Making the teasers more intriguing would be one approach, another would be to deliver the complete content in the newsletter — people have short attention spans, and having to click through to go to your site to get the rest of the article is proving to be to much “work” for most of them.
Why do people appear to open your ezines multiple times? I think this is probably not because they are so interested, it’s just because your email is in their inbox and if they delete the email just next to yours, your newsletter then becomes automatically selected and your Email Service Provider registers it as another “open.” This, at least in some cases, probably means they save your emails.
With 100 contacts, I have obtained a 25% of open rate, and 2% of click though.
It depends on what kind of company you run. If you offer something, like products to sell, a click through of 5-8% might be a little low.
I run an advisor company, so my news letter is used to get leads to know my company and the links are mostly connection to my website and social media profiles.
In this case, I think the most important thing is the open rate. The redemption will have to be calculated after phone calls and secondary contacts
Really great!! Thank you for your stuff on the blog post Comparing Average Open Rates for B2B & B2C Email Newsletters, they are generally highly practical! I loved checking out your write-up.